· Design & Ambiance · 9 min read
Restaurant Seating Layout and Floor Plan: Maximize Capacity Without Sacrificing Comfort
A well-designed seating layout can increase table turnover by 20-30%. This guide covers the space allocation standards, the 60/40 rule, booth vs. table strategy, kitchen-to-dining ratios by concept, service corridor design, and the furniture choices that balance comfort with capacity.
Every square foot of your restaurant either generates revenue or supports the people and processes that generate revenue. There is no wasted space in a well-designed floor plan — only space that serves a purpose you have not identified yet, or space that is working against you.
According to PerfectCheck’s layout optimization research, a well-designed seating arrangement can increase table turnover by 20 to 30%, directly impacting revenue without adding square footage. That means the difference between a good layout and a great one is not aesthetic — it is financial.
This guide covers the standards, ratios, and strategies that turn floor space into revenue.
Space Allocation: The Numbers That Matter
Per-Seat Standards
According to PerfectCheck, the industry standard allocates approximately 20 square feet per seat to ensure guest comfort without compromising staff efficiency. At the table level, plan for roughly 300 square inches per guest, or 24 to 30 inches of table edge per person.
These numbers apply to full-service restaurants. Fast-casual and quick-service concepts can operate with somewhat tighter spacing because dwell times are shorter and guests expect a more compact environment.
The 60/40 Rule
According to PerfectCheck, the most profitable layouts maintain at least 60% of total space for seating and 40% for circulation, service stations, and back-of-house areas. This ratio represents the balance between maximizing capacity and maintaining comfortable movement.
Skew too far toward seating and you create a cramped atmosphere where servers cannot move efficiently, guests feel boxed in, and the experience suffers. Too much open space and you are paying rent on square footage that is not generating revenue.
| Space Category | Target Allocation |
|---|---|
| Dining and seating | 60% minimum |
| Circulation and service | 15-20% |
| Kitchen and prep | 15-25% (concept dependent) |
| Storage, restrooms, office | 5-10% |
Kitchen-to-Dining Room Ratios
Getting this ratio wrong is one of the most expensive design mistakes you can make. An undersized kitchen cannot keep up with the dining room during service. An oversized kitchen wastes space that could be generating revenue.
Ratios by Concept
According to Toast’s space planning guide, the standard ratios are:
| Concept | Dining : Kitchen Ratio | Kitchen % of Total | Why |
|---|---|---|---|
| Fine dining | 2:1 | ~33% | Complex menus, multiple specialized stations, extensive prep |
| Full-service casual | 2:1 to 3:1 | 25-33% | Moderate menu complexity, standard cooking lines |
| Quick-service / fast-casual | 3:1 | ~25% | Simpler menus, fewer stations, less prep space |
| Fast-service / banquet | 4:1 | ~20-25% | Streamlined menus, batch preparation |
According to Toast, the widely cited baseline allocates approximately 60% to the dining room, 30% to the kitchen, and 10% to support areas. But this varies significantly based on your specific operation.
Work Backward from the Menu
According to Toast, the most reliable approach works backward from what you plan to cook:
- List every piece of equipment needed to execute your menu at peak volume
- Calculate the prep space and storage required
- Add space for receiving, dishwashing, and waste management
- The remaining square footage is your dining capacity
According to Toast, the kitchen must be sized to serve the dining room at capacity. Undersizing the kitchen to squeeze in more tables ultimately reduces service quality and throughput. A kitchen that cannot keep up during a Friday rush means longer ticket times, more complaints, and worse reviews — regardless of how many seats you crammed in.
→ Read more: Kitchen-to-Dining Room Ratio
Booth Versus Table Strategy
This is not an either/or decision. The best layouts use both strategically.
Why Booths Work
According to Restaurant Furniture Plus:
- Privacy — High-backed benches create intimate dining nooks
- Comfort — Padded seats and back support for longer occasions
- Acoustic separation — Booth walls absorb sound between parties
- Space efficiency — Booths fit the same number of guests in 25 to 30% less floor space than freestanding tables because they share walls and eliminate the gap between chair backs
Why Tables Work
According to Restaurant Furniture Plus:
- Flexibility — Quick rearrangement for different group sizes, push together for large parties
- Maintenance — Hard surfaces sanitize quickly, chairs move for floor cleaning
- Lower cost — Both initial purchase and individual replacement
- Accessibility — Chairs can be removed to accommodate wheelchairs
The Turnover Factor
According to Restaurant Furniture Plus, guests at tables tend to finish meals faster, while booth comfort encourages lingering. This creates a strategic decision:
- High-turnover lunch operations — More tables = faster turns = more covers
- Dinner-focused and experience-driven concepts — More booths = longer stays = higher average check (more drinks, desserts, appetizers)
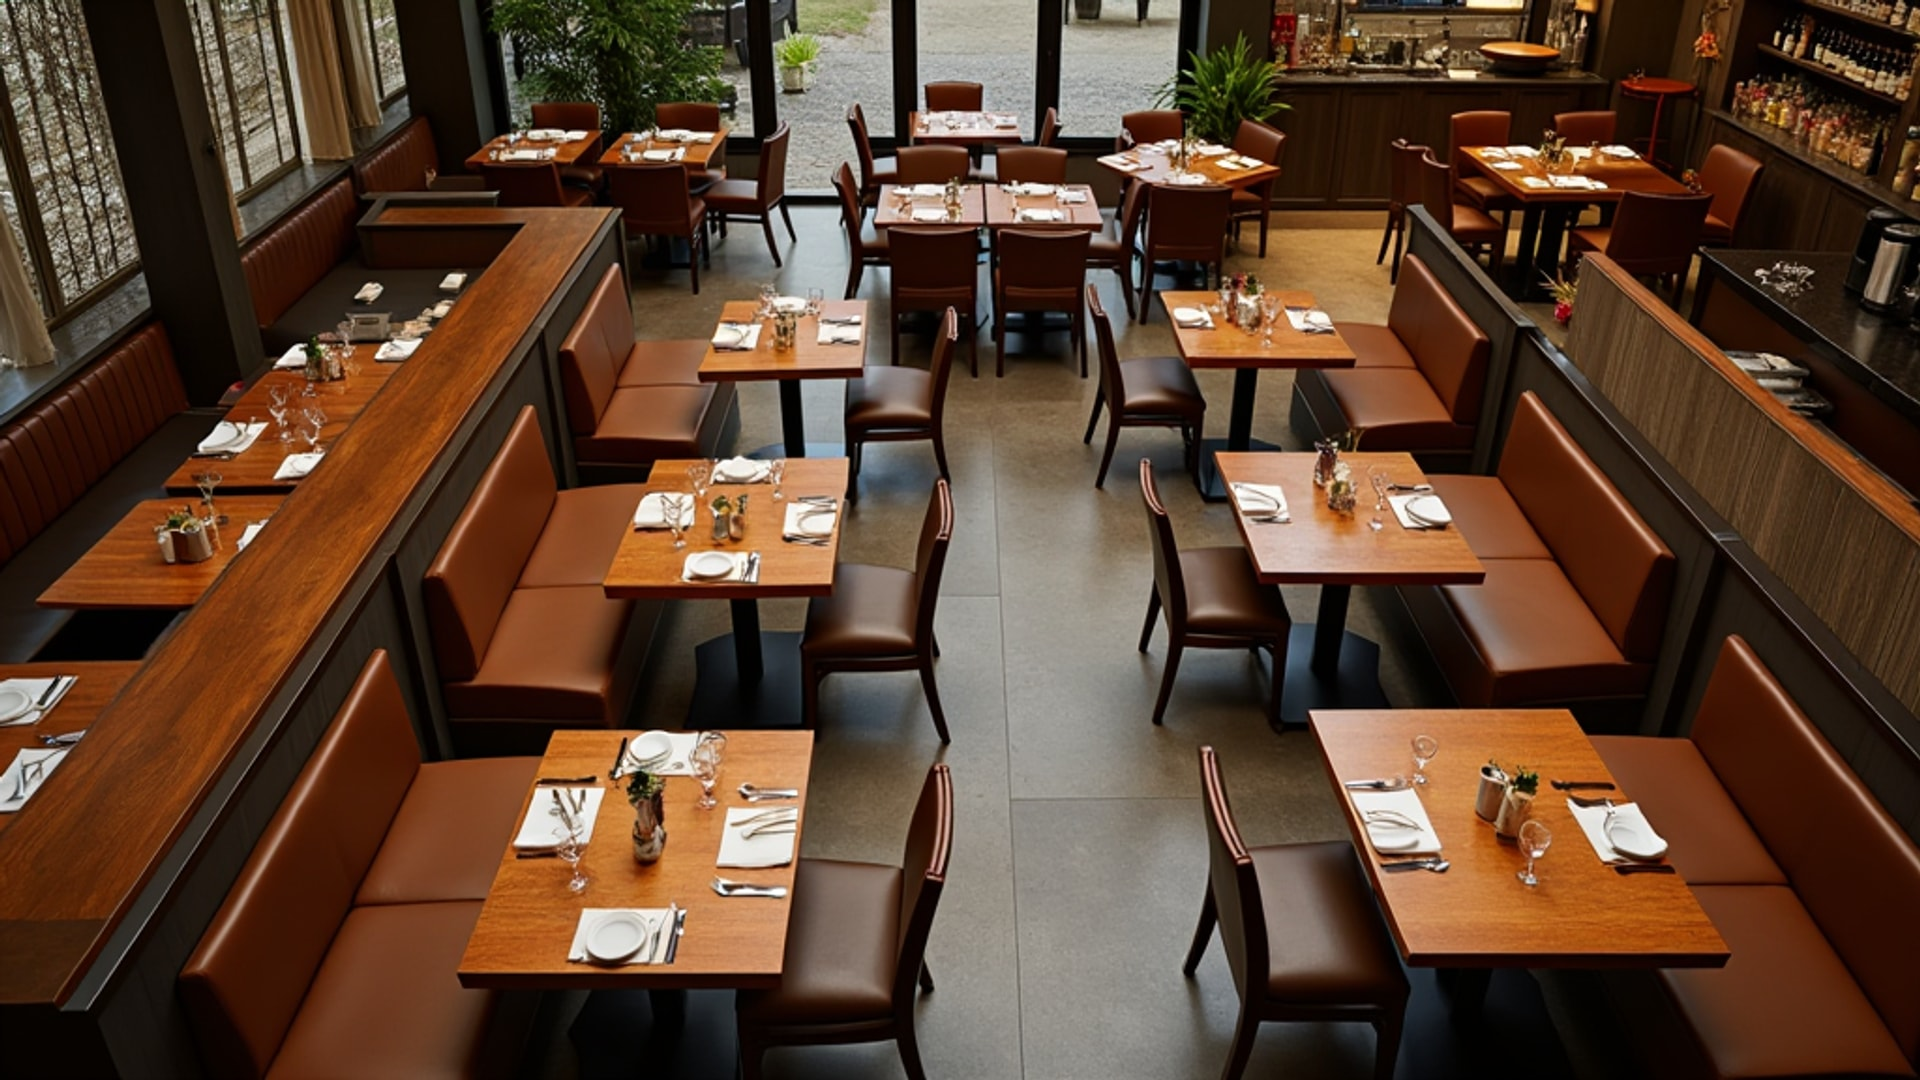
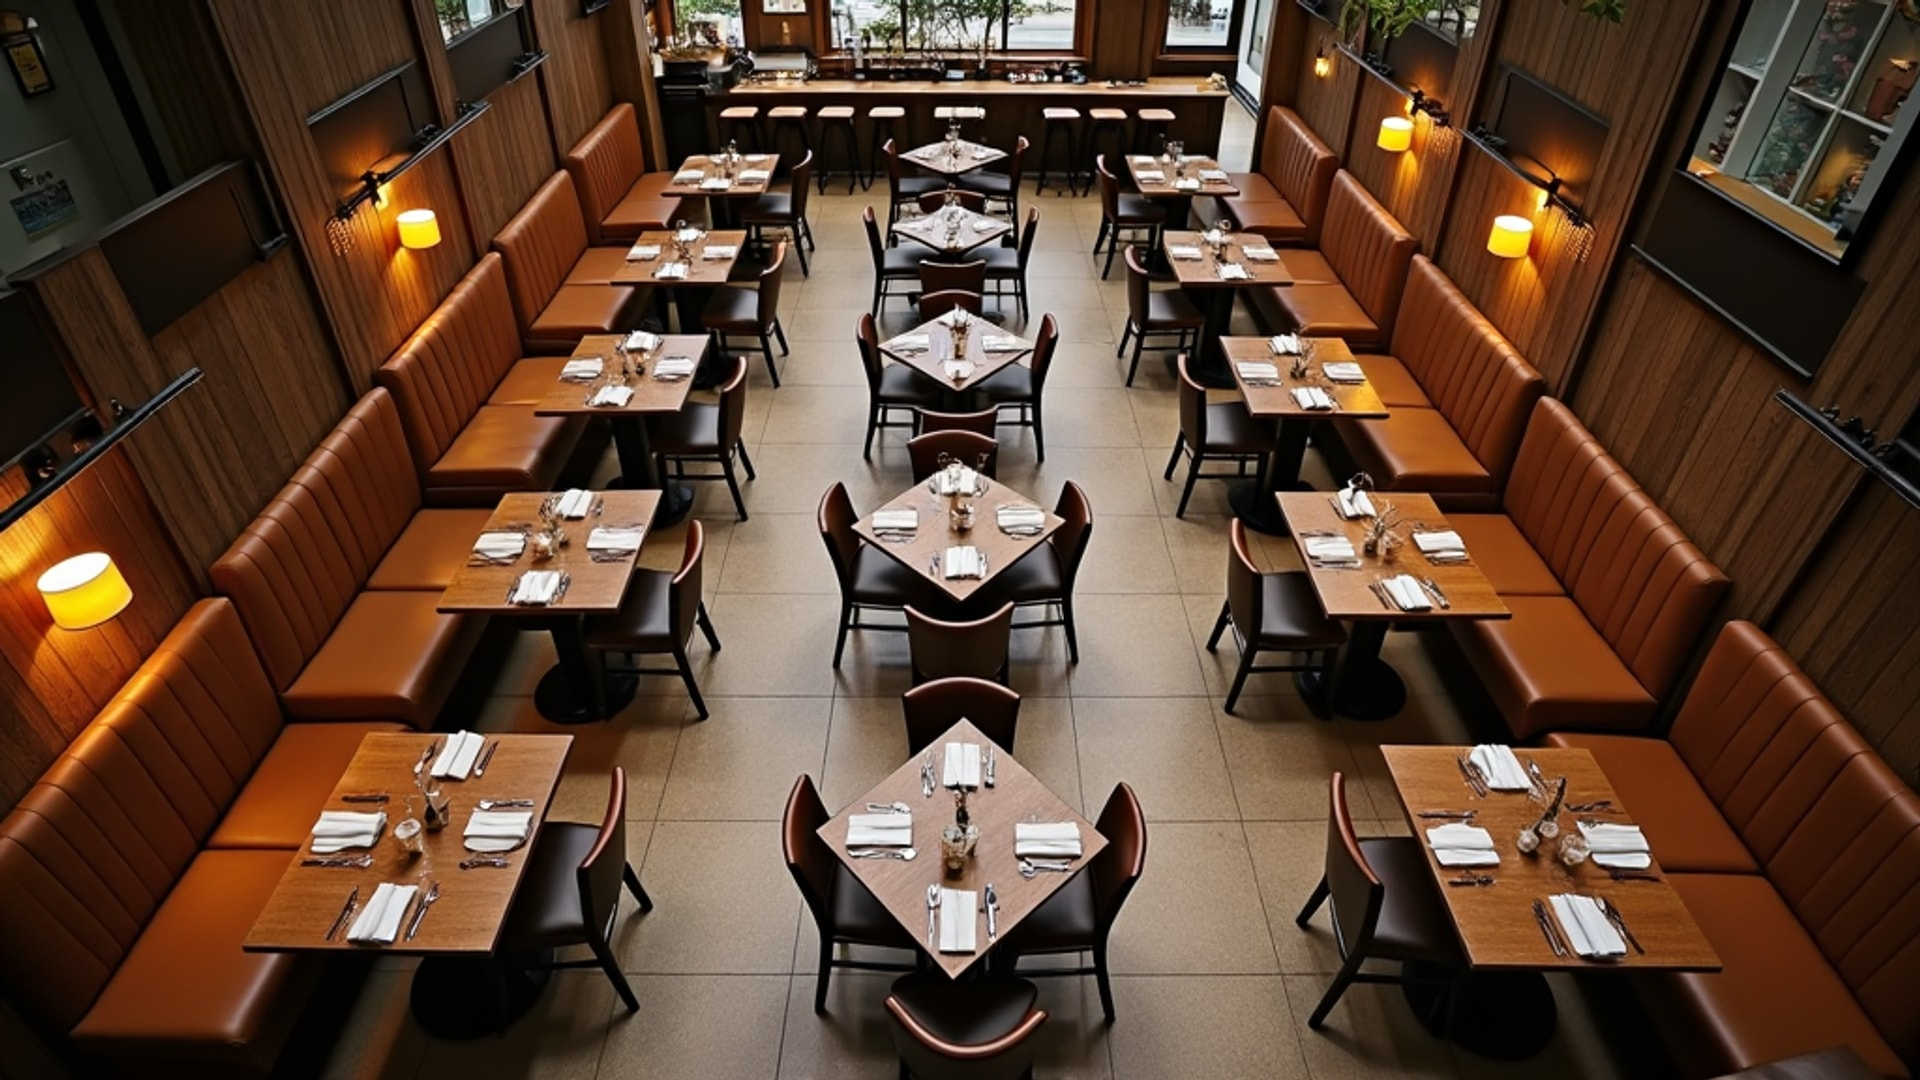
The Optimal Mix
According to Restaurant Furniture Plus, most designers recommend approximately 50% booths to 50% tables. The classic arrangement: perimeter booths along the walls with freestanding tables in the center. This maximizes flexibility while giving guests a choice.
Adjust based on your concept and service style:
| Concept | Booth % | Table % | Rationale |
|---|---|---|---|
| Fine dining | 40-60% | 40-60% | Comfort and privacy justify booth investment |
| Casual dining | 50% | 50% | Balanced for varied service periods |
| High-turnover lunch | 30-40% | 60-70% | Tables turn faster |
| Bar-forward | 20-30% | 40-50% + bar seating | Bar seats are the highest RevPASH positions |
→ Read more: Restaurant Booth vs. Table: Making the Right Seating Mix Decision
Table Configuration Strategy
According to PerfectCheck, different table shapes serve different purposes:
Two-tops (tables for 2) — Your most flexible units. Can be pushed together for 4-tops on demand. Keep plenty of these.
Four-tops — The workhorse. Accommodate the most common party size (2-4 guests) while providing enough surface area for food and drinks.
Round tables — Foster intimate conversation. Work well for odd-numbered parties (3 or 5) where rectangular tables waste space.
Communal tables — Efficient for solo diners and walk-ins. Create energy and social atmosphere. Not ideal for private conversations.
Banquettes — According to PerfectCheck, wall-mounted banquettes maximize seating in limited spaces by eliminating chairs on one side. Highly space-efficient.
Flexibility Matters
Build in the ability to reconfigure. Choosing the right commercial furniture is critical here. A dining room full of heavy, immovable furniture cannot adapt to a Tuesday lunch with all two-tops and a Saturday night with large parties. According to Barstool Comforts, extendable and nesting tables accommodate varying party sizes without dedicating space to large tables that sit empty during slower periods.
Service Corridor Design
Your layout must work for the people carrying plates, not just the people eating from them.
According to PerfectCheck, full-service concepts need 38 to 48 inches between pushed-in chair backs for efficient server movement. These corridors must accommodate:
- Peak-hour server traffic (multiple servers passing simultaneously)
- Wheelchair accessibility (36 inches minimum pathway width per ADA)
- Busing without disrupting adjacent diners
- Tray stands and service equipment placement
Standard spacing of 24 to 30 inches between chair backs at adjacent tables applies in the dining area itself.
The Service Path
Map the primary service path from kitchen to every table. Identify bottlenecks where servers will collide, where trays will swing close to seated guests, and where busing stations create congestion. The busiest path in the restaurant — kitchen door to the farthest table — should have the widest clearance.
Small Space Optimization
Working with limited square footage requires different strategies, and a dedicated small-space design approach can make a significant difference. According to Barstool Comforts, the optimal allocation for small restaurants is 30 to 40% kitchen with 60 to 70% dining.
Space-Saving Furniture
According to Barstool Comforts:
- Armless chairs — Eliminate bulky arm profiles, allowing tighter table configurations
- Backless bar stools — Tuck completely under counters when not in use
- Banquette seating along walls — Uses space efficiently while creating intimacy
- Stackable chairs — Store away during slow periods to open the room
- Storage benches — Dual purpose: seating plus concealed storage
Visual Expansion
According to Barstool Comforts, several techniques make small spaces feel larger:
- Strategic mirror placement opposite windows amplifies natural light and creates the illusion of depth
- Vertical shelving draws the eye upward, creating a perception of height
- Light wall colors and reflective ceiling finishes enhance openness
- Layered lighting transforms the same space for different dayparts
Technology That Saves Space
According to Barstool Comforts:
- QR code menus eliminate paper clutter and enable real-time updates
- Mobile POS devices allow tableside payment, eliminating a dedicated checkout area
- Digital reservation systems with text notifications reduce entrance crowding
ADA Compliance: Non-Negotiable
According to PerfectCheck, all layouts must comply with Americans with Disabilities Act requirements:
- Accessible pathways at least 36 inches wide throughout the restaurant
- Accessible seating distributed throughout the dining room, not isolated in one area
- Accessible restroom access from the dining room
- Table height — At least 5% of tables (minimum one) must accommodate wheelchair users with clearance under the table
According to PerfectCheck, compliance should be integrated into the initial design rather than retrofitted. Post-construction modifications are consistently more expensive and often compromise the design intent.
Furniture Selection Guide
Commercial Grade Is Non-Negotiable
According to the topic synthesis, residential furniture cannot withstand daily restaurant use. Invest in commercial-grade pieces from the start.
Materials by Concept
| Material | Best For | Considerations |
|---|---|---|
| Solid wood tops | Upscale dining | Need heat-resistant finishes; require maintenance |
| Laminate and veneer | Casual concepts | Easy to clean; frequent reconfiguration friendly |
| Metal frames | All concepts | Maximum durability; easy cleaning; industrial aesthetic |
| Upholstered seating | Fine and casual dining | Increases comfort but adds maintenance; stain-resistant fabrics essential |
| Stackable options | Multi-use spaces | Simplify storage and cleaning; ideal for event flexibility |
Key Dimensions
According to the topic synthesis, the optimal dining table height is 30 inches paired with 18-inch seat height chairs. Good back support is essential for dining occasions exceeding 30 minutes.
Where to Invest
According to Barstool Comforts, investment should be weighted toward high-traffic items like bar stools that take the most abuse. A bar stool gets sat on, leaned against, scraped across the floor, and spun dozens of times per day. Spend the money here first.
Measuring Your Layout’s Performance
Track these metrics to evaluate whether your layout is working:
| Metric | What It Tells You |
|---|---|
| Revenue per available seat hour (RevPASH) | How much each seat earns per hour |
| Average table turn time | How quickly tables cycle during peak |
| Peak-hour seat utilization | What percentage of seats are occupied during rush |
| Wait time to seating ratio | Whether your host stand is creating bottlenecks |
| Server steps per cover | Whether your layout supports efficient service |
| Guest satisfaction (comfort/spacing) | Whether you have gone too tight |
The Bottom Line
Your floor plan is a revenue model expressed in furniture and square footage. Every seat, every aisle, every inch of kitchen space should justify its existence through either direct revenue generation or efficient support of the people creating that revenue.
Start with the ratios: 60/40 for overall space, the right kitchen-to-dining ratio for your concept, and a booth-to-table mix that matches your service style. Build in flexibility. Design for ADA compliance from day one. And measure relentlessly — because a layout that increases turnover by even 10% on your existing square footage is worth more than any renovation.
→ Read more: Restaurant Kitchen Layout Types
→ Read more: Restaurant Flooring Materials